


 English
 Español
 Français
Late Cycle Supply Sources of the Occupancy Gap By Bram Gallagher
9 min read

The present hotel cycle is defying conventional expectations of late-cycle Revenue Per Available Room (RevPAR) behavior. Over the previous two cycles, recovery began primarily with occupancy. As the cycles continued, average daily rate (ADR) began to rise. Eventually, the increases to ADR were the dominant contributor to RevPAR growth, and occupancy leveled off or even slightly declined.
These cycles, occurring from August 1992 to November 2002 and November 2002 to May 2010, lasted approximately ten and eight years, respectively. Well into the ninth year of its current cycle, we would expect that the hotel market would be showing the tell-tale occupancy and rate growth pattern seen in previous late-cycle periods; however, rather than driving RevPAR, real ADR (RADR) is barely moving nationally. Where we would have seen declining occupancies in the past, present occupancies are breaking new records seemingly every quarter.
Something may have changed about the way the hotel market operates, and several theories have been proposed or considered as possible explanations. While the traditional suspect for downturns in real RevPAR (RRevPAR) growth is supply overbuilding, recent developments in disruptive short-term lodging companies such as Airbnb have been raised as a possible contributor to sluggish rate growth.
In this article, I investigate the size of the discrepancy between occupancy and RADR. I then look to growth in conventional supply and in unconventional, short-term lodging supply. These two supply issues seem to bear equal weight in explaining the strange occupancy and rate behavior, and taken together account for more than half of the apparent gap between real RADR and occupancy.
RevPAR growth stems from both changes to ADR and occupancy. (Changes in RevPAR can be decomposed into the two contributions of its constituent components, Average Daily Rate (ADR) and Occupancy. RevPAR can be defined as RevPAR=ADR×Occupancy. Taking the total derivative yields dRevPAR=dADR×Occupancy+dOccupancy×ADR, substituting the discrete approximation yields).
 — Source: CBRE Hotels
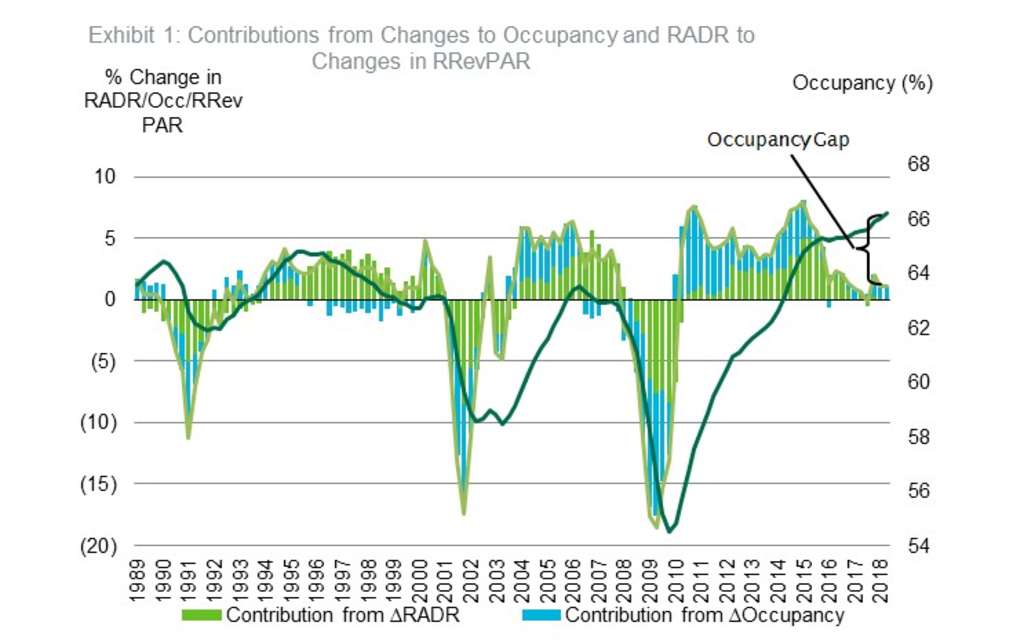
Breaking RevPAR into its two parts has, for the previous two cycles, provided a characteristic progression through the lodging cycle. Exhibit 1 illustrates this decomposition applied to the national hotel market, adjusted for inflation using the national CPI and using a 4-quarter moving average of occupancy for comparison.
The typical pattern can be easily observed in previous cycles. Early positive occupancy contributions change to negative in the later portion of the cycle. RADR contributions increase in importance and come to dominate in the middle or late cycle. Although the beginnings of this pattern began to emerge, and occupancy's contribution even became negative briefly in Q1 2016, afterwards occupancy again began to rise while real ADR stagnated or retreated. As a result, an unprecedented gulf between the observed occupancy and the growth of RADR and RRevPAR has opened, beginning around 2015 with a steep decline in RRevPAR growth. I call this distance the 'occupancy gap'.
(?RevPAR=?ADR×Occupancy+?Occupancy×ADR.. where is the contribution from changes in ADR and is the contribution from changes in occupancy. Dividing the contribution by RevPAR yields the percentage change in RevPAR attributable to that contribution's variable.)
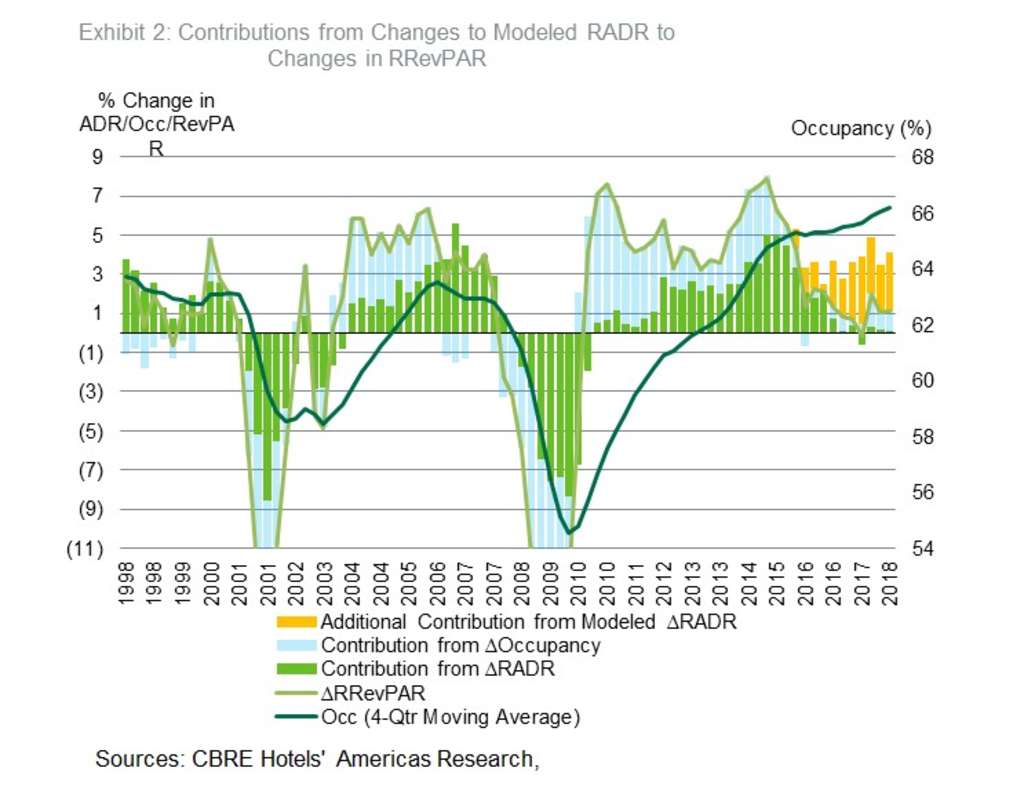
I assess the scale of the gap to find out how important this effect is, which markets are affected and what the related variables are. The gap can be measured two ways: how low RADR is given where occupancy is or how high occupancy is given RADR. An estimate of the size of the RADR shortfall can be obtained by estimating, with an econometric model, relationships between hotel performance and economic variables up to Q3 2015, then fitting these relationships with the observed demand and supply.
The amount that this fitted RADR would have contributed to RRevPAR is illustrated in yellow in Exhibit 2. Since Q3 2015, RRevPAR has grown an average of 2.1% less year-over-year than if RADR had grown commensurately with what the historical occupancy and RADR relationship suggests. Over the same period, observed RRevPAR growth only achieved 1.5% year-over-year growth, less than half the expectation given the occupancy and historical relationships. Note that the entire gap is not filled with the modelled ADR contribution.
 — Source: CBRE Hotels
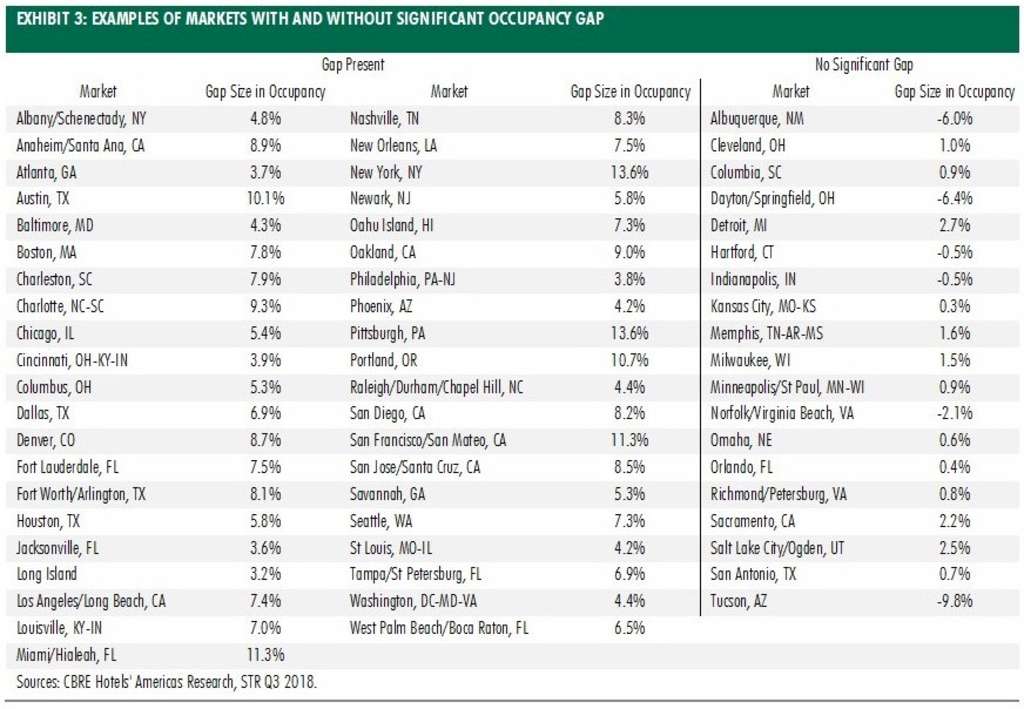
Alternatively, the gap can be quantified by estimating how much excess occupancy there is given the low RADR growth rate. I estimate the effect of occupancy on RADR growth along with a dummy variable that allows the effect to change on or after 2015. This procedure essentially estimates whether the threshold occupancy that triggers increases to RADR, called the natural occupancy rate, has changed, and what direction that change has taken.
Of the 60 markets that CBRE Hotels' Americas Research tracks most closely, 18 had no statistically significant effect. This means that either the effect has not taken place, or has arisen so recently that it is indistinguishable from statistical noise. Another 41 markets had a significant effect that raised the natural occupancy threshold, making it more difficult for hotels to raise rates in those markets. Tucson was the only market that had a significant decrease in the natural occupancy threshold, making it easier to raise rates. The markets are detailed in Exhibit 3 below.
 — Source: CBRE Hotels
Why are rates not seeing the expected growth given the high and increasing occupancy? I investigate two supply-related causes of the slower-than-expected RADR growth: increases to conventional hotel supply that constrain revenue manager's pricing power while keeping occupancy high and increases to unconventional sharing economy supply that may limit compression pricing.
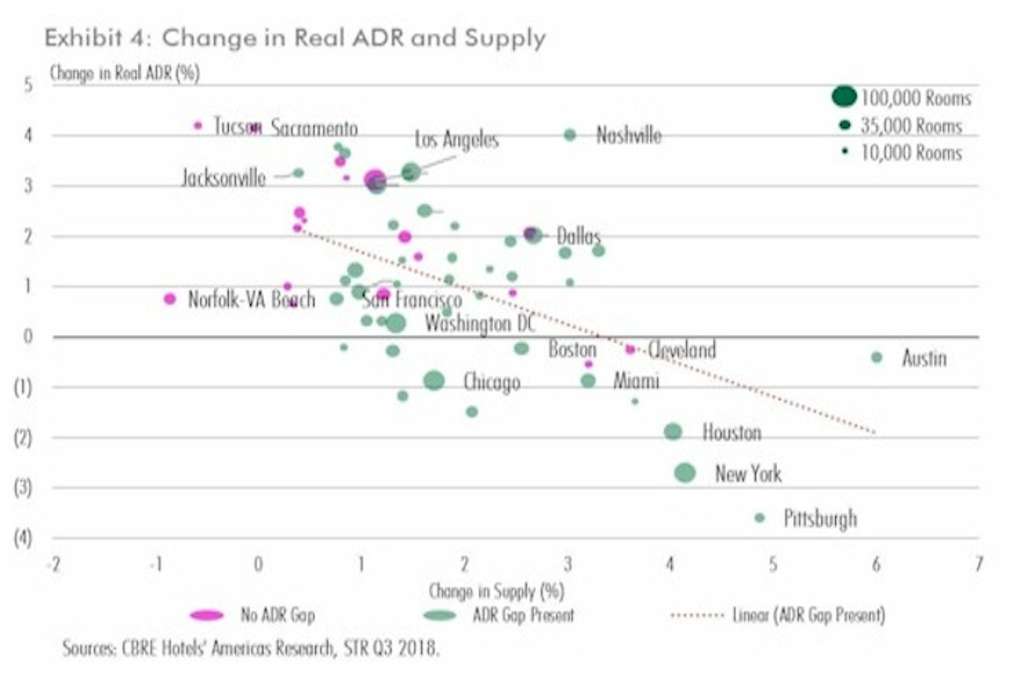
Hotel operators are concerned with over-supply with good reason. Increases to supply may reduce the attractiveness of older properties and increase competition in the market as a whole, stalling or even lowering rates. It could be the case that tepid RADR and plunging RevPAR growth are the results of late-cycle supply additions accelerating. If this was the case, then we would expect that supply growth in the markets that have a significant occupancy gap to exceed that of the markets that do not. Exhibit 4 plots changes to RADR against changes to supply in 60 markets over the period in which the gap occurred-Q2 2014 through Q2 2018. The market size in rooms is reflected by the size of the representative dot, and markets with a significant occupancy gap are in green. Markets with no significant gap are in magenta.
 — Source: CBRE Hotels
The negative relationship between supply growth and RADR growth is described by the dashed orange line. Although the change in supply seems to have some association with the presence of an occupancy gap, there are some markets with no gap that have high changes to supply, such as Cleveland, and markets that have a significant gap and low changes to supply, such as Jacksonville. No market with an occupancy gap has a supply growth rate of lower than 0.4%, and every market with supply growth greater than 3.6% has a significant gap. When analyzed in isolation, supply changes can explain between a quarter and a third of the variation in the size of the occupancy gap.
Unconventional supply changes in the form of sharing economy listings on sites such as HomeAway and Airbnb may also represent an increase in competition in a market. Sharing economy sites can quickly adjust supply available during peak demand or whenever some unknown reservation RADR is reached. In the presence of sharing economy alternatives not only are consumers more price sensitive in the face of more accommodation options, but also supply becomes price-sensitive.
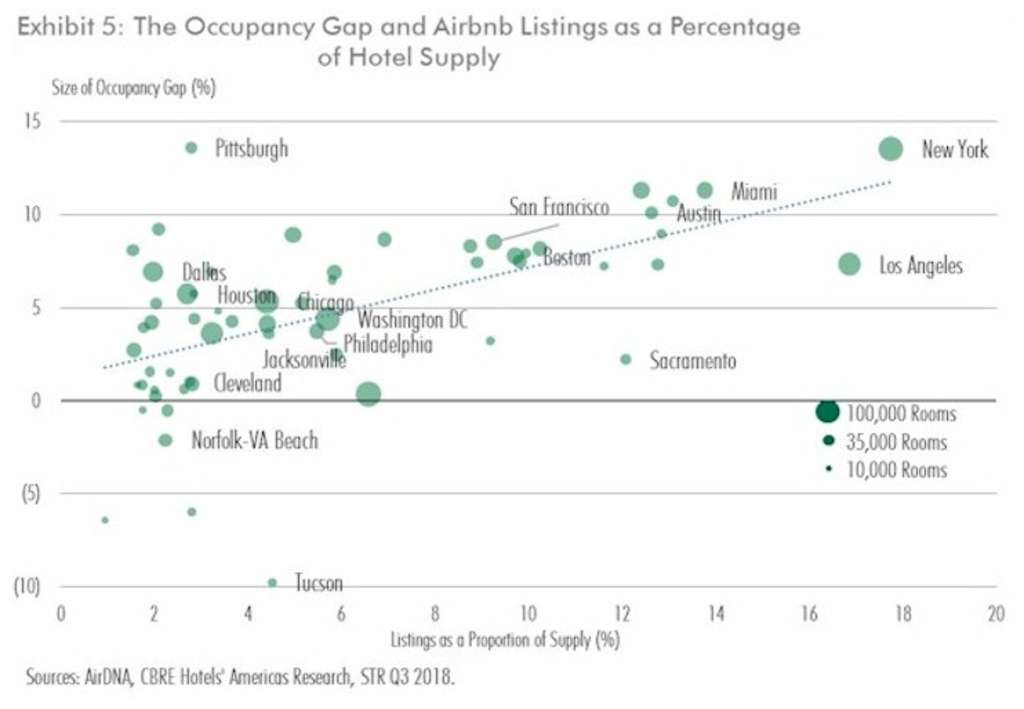
The possibility of new supply entering as RADR increases may convince revenue managers to restrict rate increases preventatively, resulting in higher occupancy and lower rates than otherwise. The peak demand RADR is trimmed off by sharing economy flexible supply, having the effect of lowering average RADR and thus expanding the gap. Exhibit 5 illustrates the size of the occupancy gap along with the supply of Airbnb listings, the largest single source of sharing economy listings, as a percentage of the markets' total hotel supply.
 — Source: CBRE Hotels
When analyzed by itself, Airbnb listings have about the same explanatory power as conventional supply shifts-between one-quarter and one-third of the variation in the occupancy gap across markets is explained by Airbnb listings. When using both supply change and Airbnb listings, over one half (R2=53%) of the variation is explained and both explanatory variables are very precisely estimated (t>5), indicating that the two variables are each contributing unique explanatory information. It is important to keep in mind that the explanatory power described here is indicative of correlation, rather than causation, but variables estimated with this high a degree of precision and correlation that have sound theoretical reasons for affecting the gap in the manner estimated are excellent candidates for important causes of the occupancy gap.
The occupancy gap remains an ongoing, distinguishing feature of the current hotel cycle. The causes of the gap, rather than being monolithic, likely stem from many causes working together to push the lodging market in previously uncharted territory. In this paper, I have described some promising factors. While significant research into alternative explanations such as the rise of online travel agencies and new revenue management technologies remains, conventional and unconventional supply changes may go a long way to solving the occupancy gap puzzle.

Bram Gallagher is an Economist for CBRE Hotels' Americas Research. He maintains performance forecasting models for 60 major U.S. hotel markets, performs consulting work for a destination marketing organization, creates tools for hotel developers, and examines the effects natural disasters have on hotel occupancy. His background in statistical modeling and understanding of how markets operate have allowed him to reveal powerful, new insight into the future of the lodging industry. Mr. Gallagher has worked as a professor at Middle Tennessee State University and Berry College. He left Academia for a research position in the lodging industry in 2015 to better learn how economics is practiced. Mr. Gallagher can be contacted at 404-812-5189 or [email protected]
3550 Lenox Road, Suite 2300
Atlanta, GA 30326
United States
Phone: (404) 812-5024
pip.cbrehotels.com